1
The water observation
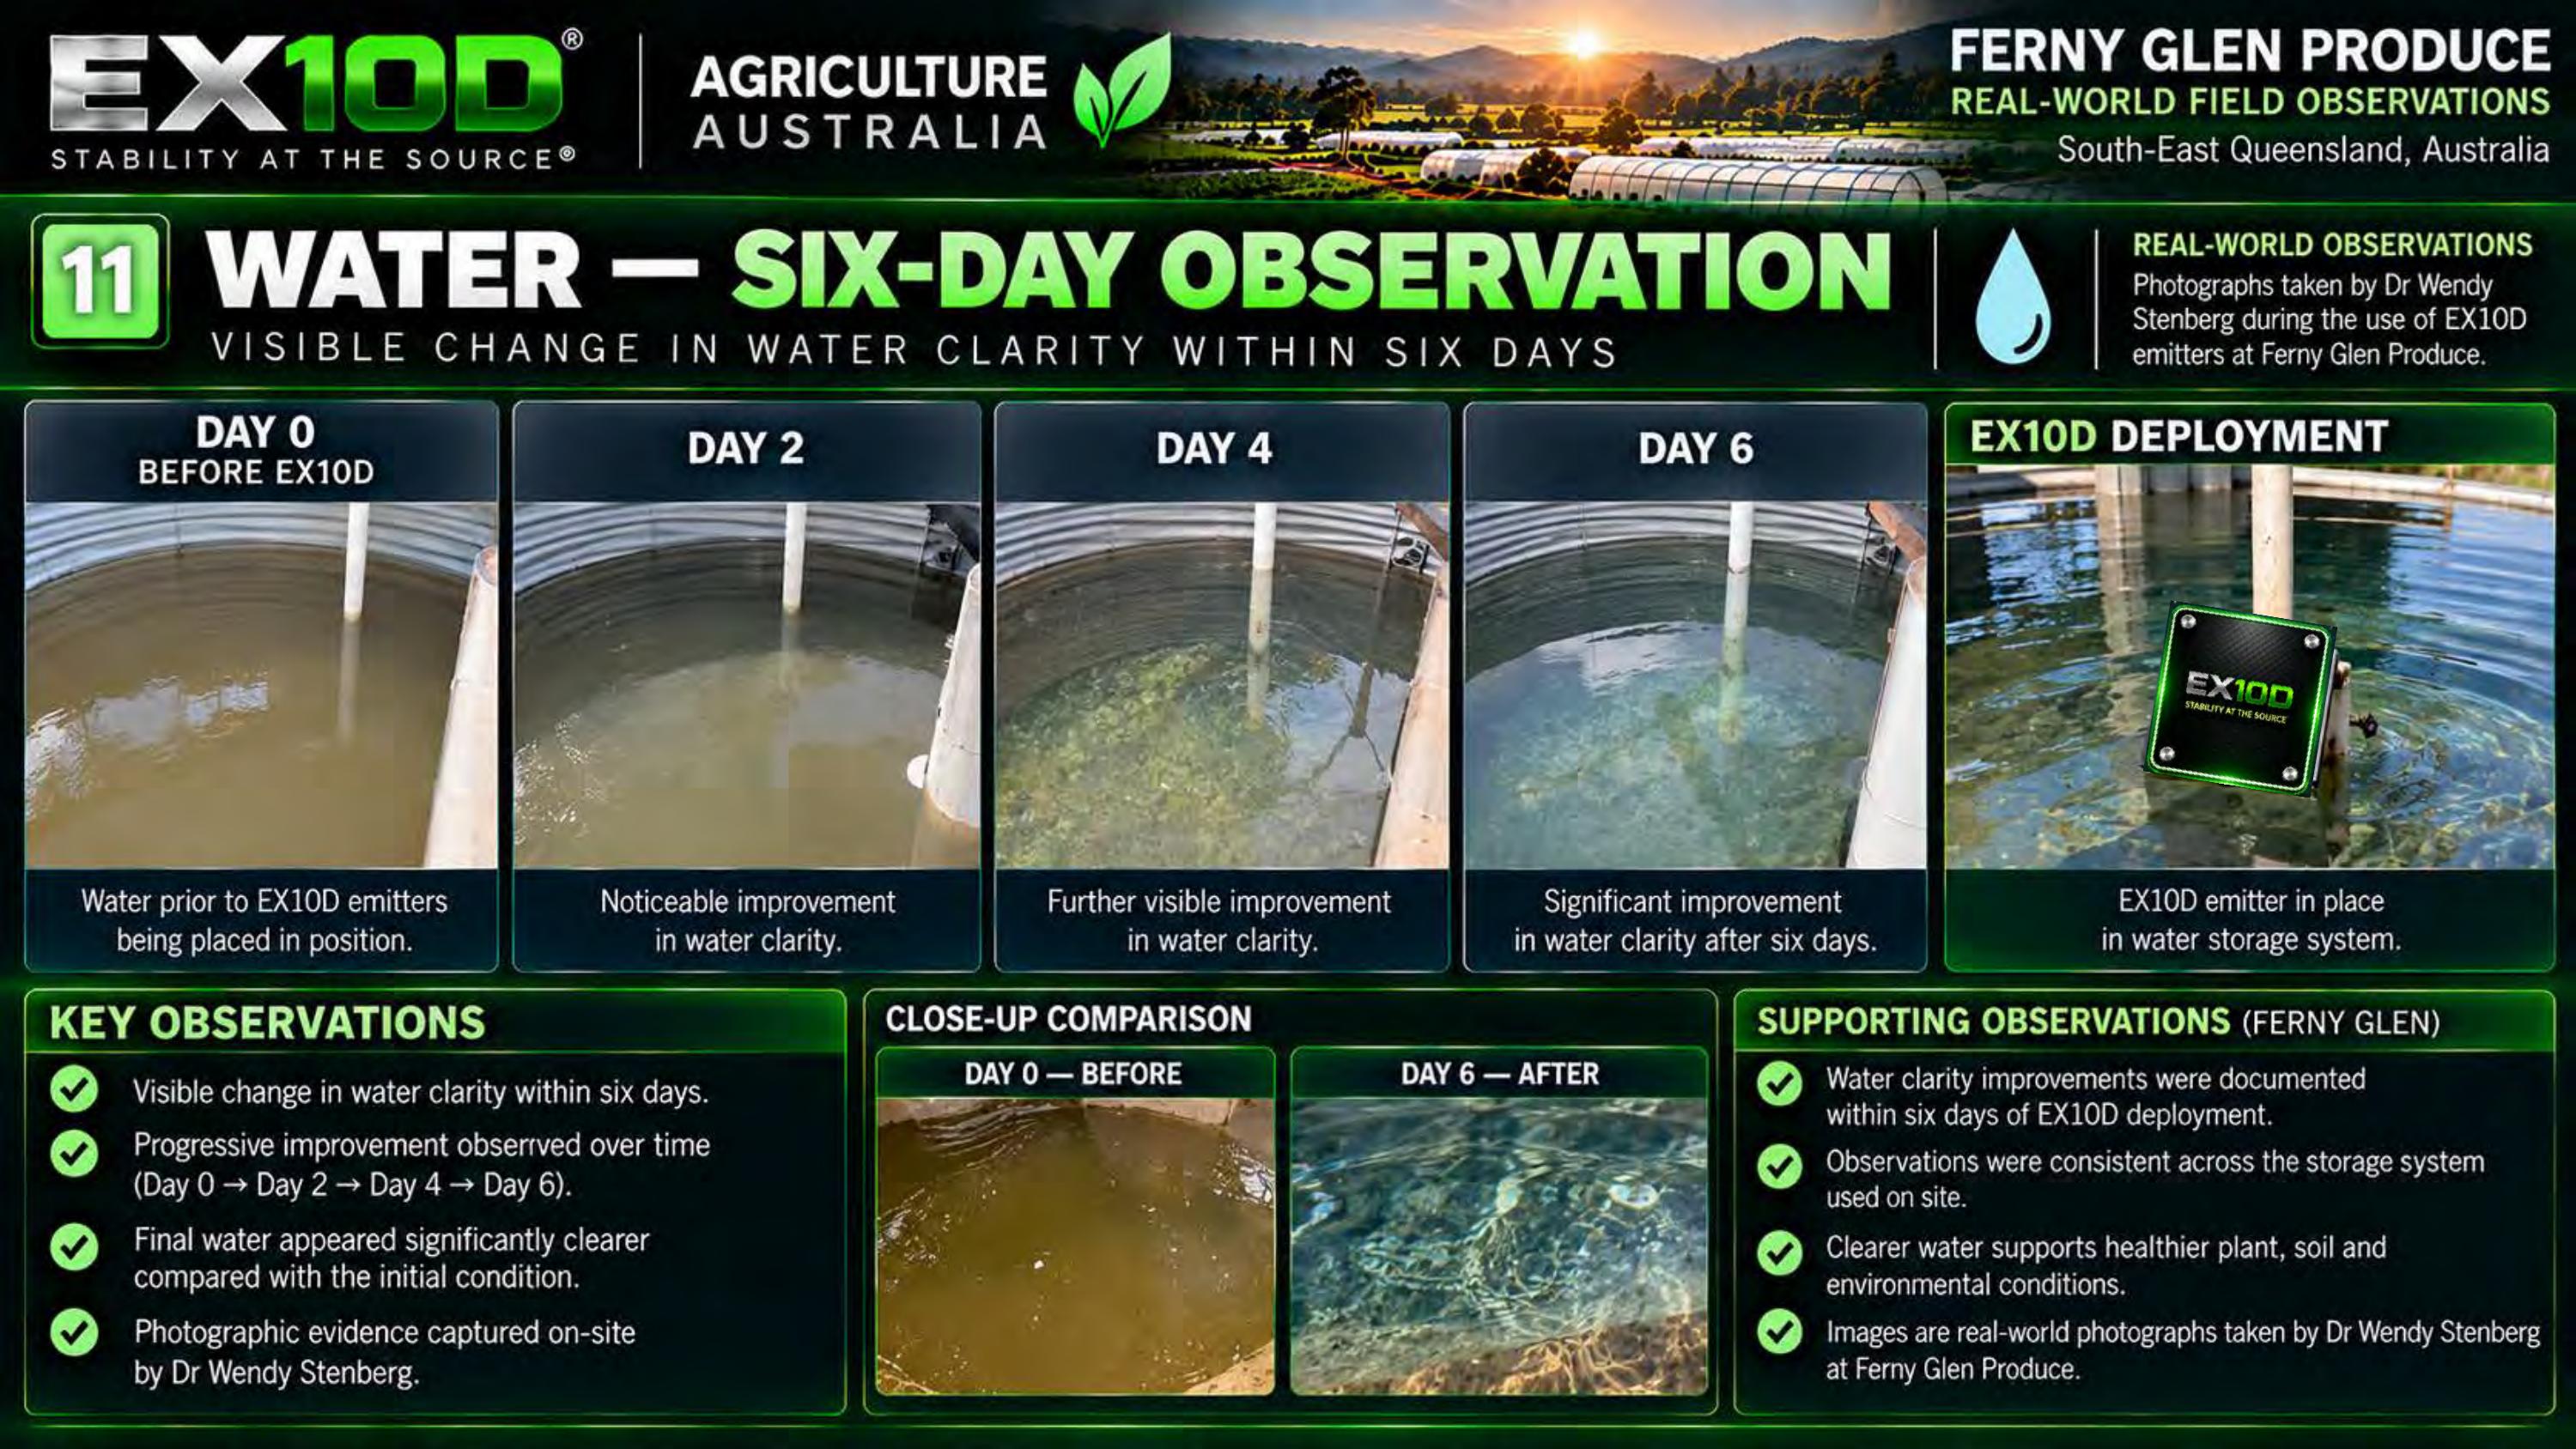
A visible improvement was reported at Day 2, further improvement at Day 4, and significantly clearer water at Day 6. The sequence is photographic observation, not laboratory proof.
Water clarity and farm operations
Ferny Glen’s historical photographs record a progressive visible change in water clarity from Day 0 through Day 6 after deployment.
A visible improvement was reported at Day 2, further improvement at Day 4, and significantly clearer water at Day 6. The sequence is photographic observation, not laboratory proof.
The proposed validation program measures turbidity, total dissolved solids, pH, electrical conductivity, oxidation-reduction potential, dissolved oxygen, temperature and microbiology across A–B–A2–B2 phases.
Dr Stenberg’s account describes fewer water-treatment steps, reduced chemical handling and manual intervention, and more time for crop observation and management. Potential efficiencies require measurement and validation.
Read the source
Historical observations do not, by themselves, establish causation, mechanism or universal performance. Results may vary between properties, crops, seasons and conditions. Independent validation is encouraged.
Real conversations. Real impact.